Kotlin Notebook에서 지원하는 출력 형식
Kotlin Notebook은 텍스트, HTML, 이미지를 포함한 다양한 출력 유형을 지원합니다. 외부 라이브러리의 도움을 받아 출력 옵션을 확장하고 차트, 스프레드시트 등으로 데이터를 시각화할 수 있습니다.
각 출력은 Jupyter MIME 유형을 특정 데이터에 매핑하는 JSON 객체입니다. Kotlin Notebook은 이 맵에서 지원되는 MIME 유형 중 다른 유형보다 우선순위가 가장 높은 유형을 선택하여 다음과 같이 렌더링합니다:
- 텍스트는
text/plainMIME 유형을 사용합니다. - BufferedImage 클래스는 Base64 문자열로 매핑된
image/pngMIME 유형을 사용합니다. - Image 클래스 및 LaTeX 형식은 내부에
img태그가 포함된text/htmlMIME 유형을 사용합니다. - Kotlin DataFrame 테이블 및 Kandy 플롯은 정적 HTML 또는 이미지를 기반으로 하는 자체 내부 MIME 유형을 사용합니다. 이 방식을 통해 GitHub에서도 표시할 수 있습니다.
예를 들어, 마크다운(Markdown)을 셀 출력으로 사용하기 위해 매핑을 수동으로 설정할 수 있습니다:
MimeTypedResult(
mapOf(
"text/plain" to "123",
"text/markdown" to "# HEADER",
//기타 mime:value 쌍
)
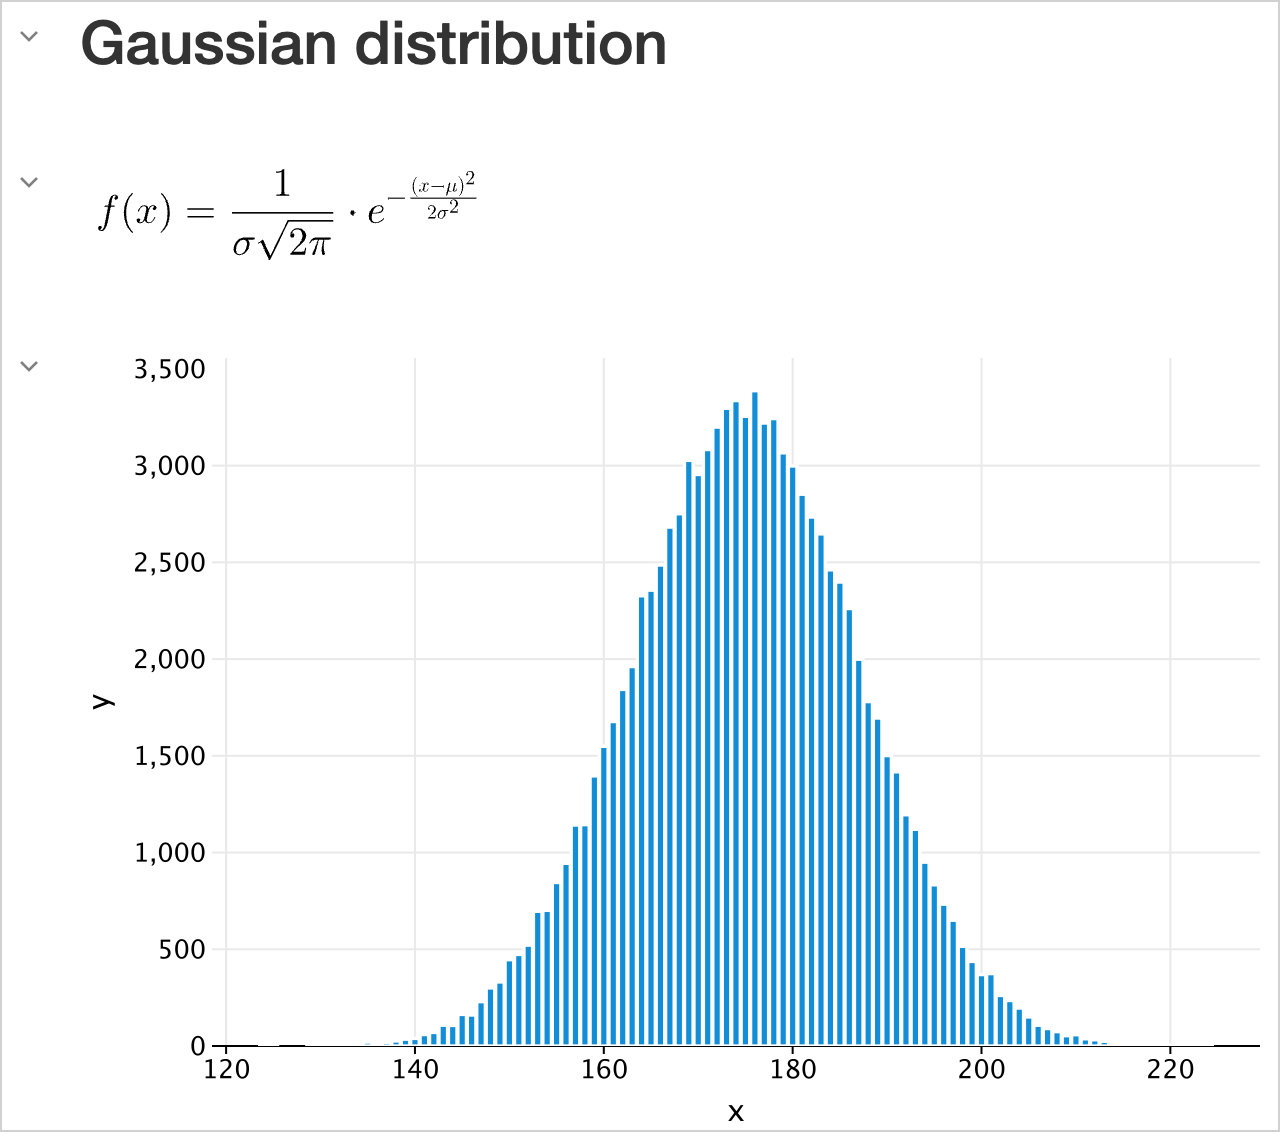
)모든 종류의 출력을 표시하려면 DISPLAY() 함수를 사용하세요. 또한 여러 출력을 조합할 수도 있습니다:
DISPLAY(HTML("<h2>Gaussian distribution</h2>"))
DISPLAY(LATEX("f(x) = \\frac{1}{\\sigma \\sqrt{2\\pi}} \\cdot e^{-\\frac{(x - \\mu)^2}{2\\sigma^2}}"))

val experimentX = experimentData.map { it.key }
val experimentY = experimentData.map { it.value }

DISPLAY(plot {
    bars {
        x(experimentX)
        y(experimentY)
    }
})
텍스트
일반 텍스트
가장 간단한 출력 유형은 일반 텍스트(Plain text)입니다. 이는 출력문(printed statements), 변수 값 또는 코드의 모든 텍스트 기반 출력에 사용됩니다:
val a1: Int = 1
val a2: Int = 2
var a3: Int? = a1 + a2

"My answer is $a3"
- 셀의 결과가 어떤 출력 유형으로도 렌더링 및 표시될 수 없는 경우,
toString()함수를 사용하여 일반 텍스트로 출력됩니다. - 코드에 오류가 포함된 경우, Kotlin Notebook은 오류 메시지와 트레이스백(traceback)을 표시하여 디버깅을 위한 통찰력을 제공합니다.
리치 텍스트
리치 텍스트(Rich text)를 사용하려면 마크다운(Markdown) 유형의 셀을 선택하세요. 이 방법을 통해 마크다운 및 HTML 마크업으로 콘텐츠 형식을 지정하고 리스트, 테이블, 글꼴 스타일, 코드 블록 등을 사용할 수 있습니다. HTML은 CSS 스타일과 JavaScript를 포함할 수 있습니다.
## 라인 매직 (Line magics)

| 매직(Spell)                        | 설명                                                                                                             | 예시                                                                                  |
|------------------------------------|------------------------------------------------------------------------------------------------------------------|---------------------------------------------------------------------------------------|
| <code>%use</code>                  | 지원되는 라이브러리를 위한 코드를 주입합니다: 아티팩트 해결, 기본 임포트, 초기화 코드, 타입 렌더러.              | <code>%use klaxon(5.5), lets-plot</code>                                              |
| <code>%trackClasspath</code>       | 현재 클래스패스의 모든 변경 사항을 기록합니다. 아티팩트 해결 실패를 디버깅할 때 유용합니다.                      | <code>%trackClasspath [on |off]</code>                                                |
| <code>%trackExecution</code>       | 실행될 코드 조각을 기록합니다. 라이브러리 지원 디버깅에 유용합니다.                                              | <code>%trackExecution [all|generated|off]</code>                                      |
| <code>%useLatestDescriptors</code> | 사용 가능한 최신 버전의 라이브러리 디스크립터를 사용합니다. 기본적으로 번들된 디스크립터가 사용됩니다.           | <code>%useLatestDescriptors [on|off]</code>                                           |
| <code>%output</code>               | 출력 캡처 설정입니다.                                                                                            | <code>%output --max-cell-size=1000 --no-stdout --max-time=100 --max-buffer=400</code> |
| <code>%logLevel</code>             | 로그 레벨을 설정합니다.                                                                                          | <code>%logLevel [off|error|warn|info|debug]</code>                                    |

<ul><li><a href="https://github.com/Kotlin/kotlin-jupyter/blob/master/docs/magics.md">라인 매직에 대해 자세히 알아보기</a>.</li>
<li><a href="https://github.com/Kotlin/kotlin-jupyter/blob/master/docs/magics.md">지원되는 라이브러리의 전체 목록 보기</a>.</li></ul>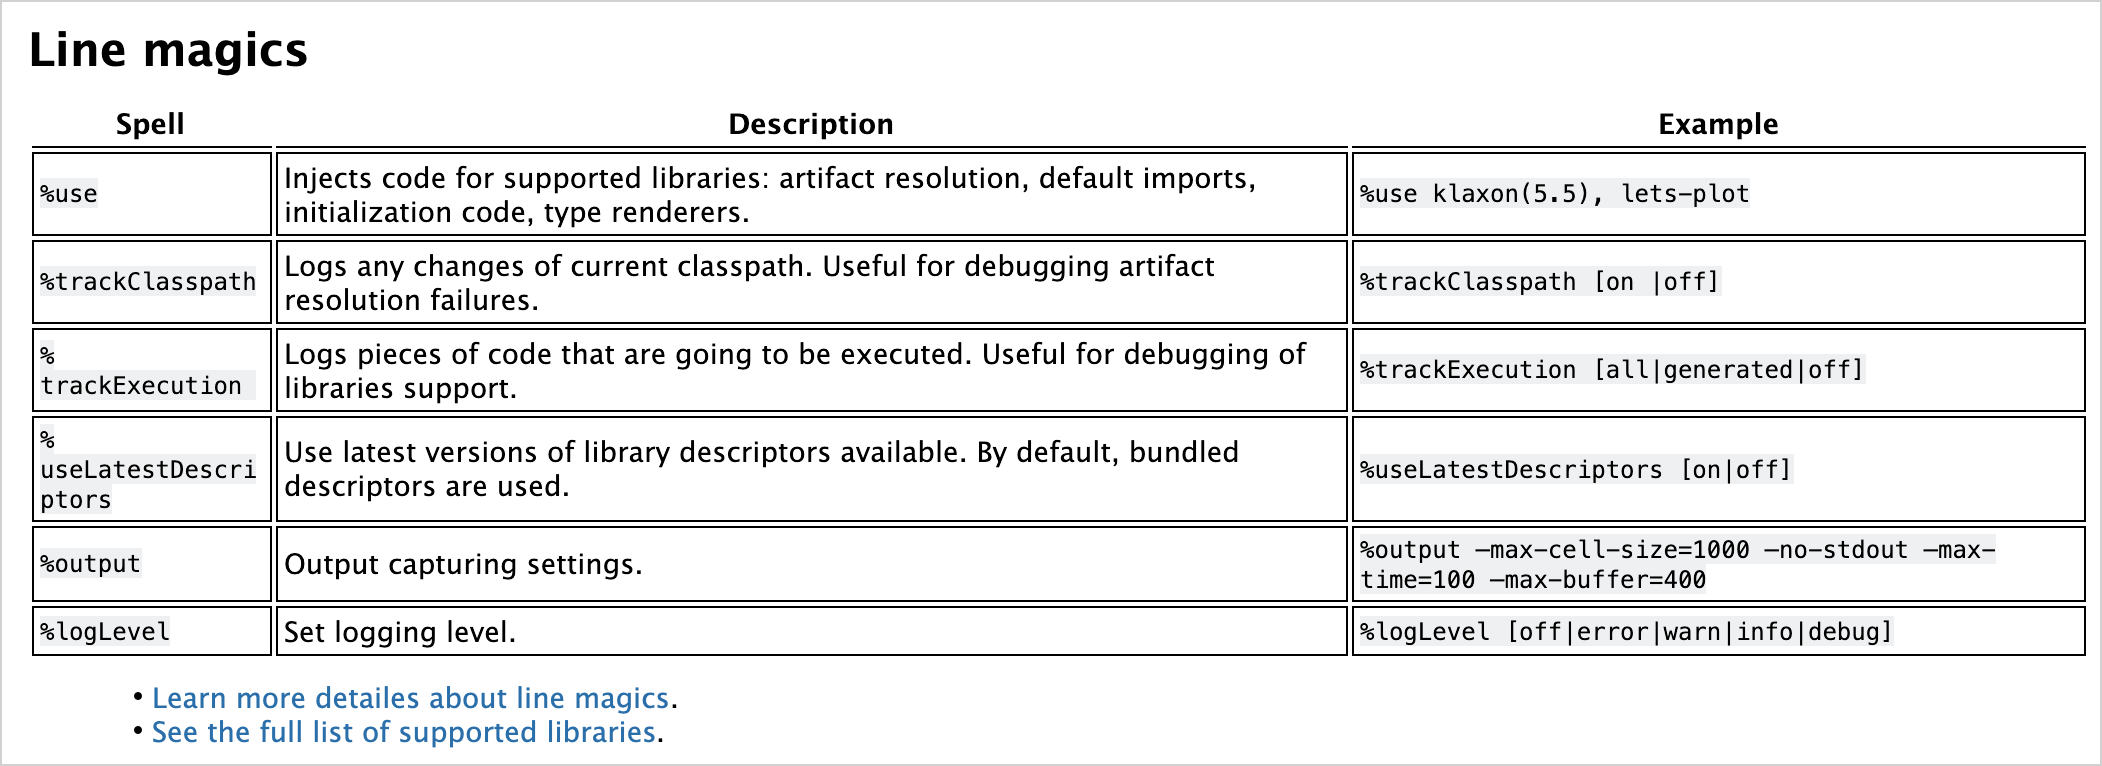
HTML
Kotlin Notebook은 HTML을 직접 렌더링하여 스크립트를 실행하거나 웹사이트를 포함할 수도 있습니다:
HTML("""
<p>Counter: <span id="ctr">0</span> <button onclick="inc()">Increment</button></p>
<script>
    function inc() {
        let counter = document.getElementById("ctr")
        counter.innerHTML = parseInt(counter.innerHTML) + 1;
}
</script>
""")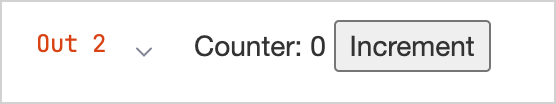
스크립트를 실행할 수 있도록 파일 상단에서 노트북을 신뢰할 수 있음(Trusted)으로 표시하세요.
이미지
Kotlin Notebook을 사용하면 파일의 이미지, 생성된 그래프 또는 기타 시각적 매체를 표시할 수 있습니다. 정적 이미지는 .png, jpeg, .svg와 같은 형식으로 표시할 수 있습니다.
버퍼링된 이미지
기본적으로 BufferedImage 클래스를 사용하여 이미지를 표시할 수 있습니다:
import java.awt.Color
import java.awt.image.BufferedImage

val width = 300
val height = width

val image = BufferedImage(width, height, BufferedImage.TYPE_INT_ARGB)

val graphics = image.createGraphics()
graphics.background = Color.BLACK
graphics.clearRect(0, 0, width, height)
graphics.setRenderingHint(
    java.awt.RenderingHints.KEY_ANTIALIASING,
    java.awt.RenderingHints.VALUE_ANTIALIAS_ON
)
graphics.color = Color.WHITE
graphics.fillRect(width / 10, height * 8 / 10, width * 10 / 20, height / 10)
graphics.dispose()
로드된 이미지
lib-ext 라이브러리의 도움으로 표준 Jupyter 기능을 확장하고 네트워크에서 로드된 이미지를 표시할 수 있습니다:
%use lib-ext(0.11.0-398)Image("https://kotlinlang.org/docs/images/kotlin-logo.png", embed = false).withWidth(300)
임베디드 이미지
네트워크에서 로드된 이미지의 단점은 링크가 깨지거나 네트워크 연결이 끊어지면 이미지가 사라진다는 것입니다. 이를 해결하려면 다음과 같이 임베디드 이미지(embedded images)를 사용하세요:
val kotlinMascot = Image("https://blog.jetbrains.com/wp-content/uploads/2023/04/DSGN-16174-Blog-post-banner-and-promo-materials-for-post-about-Kotlin-mascot_3.png", embed = true).withWidth(400)
kotlinMascot
수학 공식 및 방정식
학계에서 널리 사용되는 조판 시스템인 LaTeX 형식을 사용하여 수학 공식과 방정식을 렌더링할 수 있습니다:
Jupyter 커널의 기능을 확장하는
lib-ext라이브러리를 노트북에 추가합니다:none%use lib-ext(0.11.0-398)새 셀에서 공식을 실행합니다:
noneLATEX("c^2 = a^2 + b^2 - 2 a b \\cos\\alpha")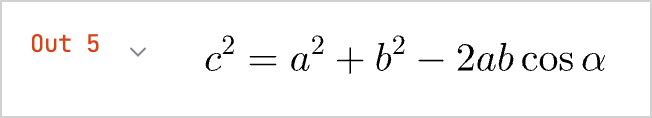
데이터 프레임
Kotlin Notebook을 사용하면 데이터 프레임(data frames)으로 구조화된 데이터를 시각화할 수 있습니다:
노트북에 Kotlin DataFrame 라이브러리를 추가합니다:
none%use dataframe데이터 프레임을 생성하고 새 셀에서 실행합니다:
kotlinval months = listOf( "January", "February", "March", "April", "May", "June", "July", "August", "September", "October", "November", "December" ) // 다양한 제품 및 월별 매출 데이터: val salesLaptop = listOf(120, 130, 150, 180, 200, 220, 240, 230, 210, 190, 160, 140) val salesSmartphone = listOf(90, 100, 110, 130, 150, 170, 190, 180, 160, 140, 120, 100) val salesTablet = listOf(60, 70, 80, 90, 100, 110, 120, 110, 100, 90, 80, 70) // Month, Sales, Product 열이 포함된 데이터 프레임 val dfSales = dataFrameOf( "Month" to months + months + months, "Sales" to salesLaptop + salesSmartphone + salesTablet, "Product" to List(12) { "Laptop" } + List(12) { "Smartphone" } + List(12) { "Tablet" }, )이 데이터 프레임은
dataFrameOf()함수를 사용하며 12개월 동안 판매된 제품(노트북, 스마트폰, 태블릿)의 수량을 포함합니다.예를 들어 가장 높은 매출을 기록한 제품과 월을 찾는 방식으로 프레임의 데이터를 탐색합니다:
nonedfSales.maxBy("Sales")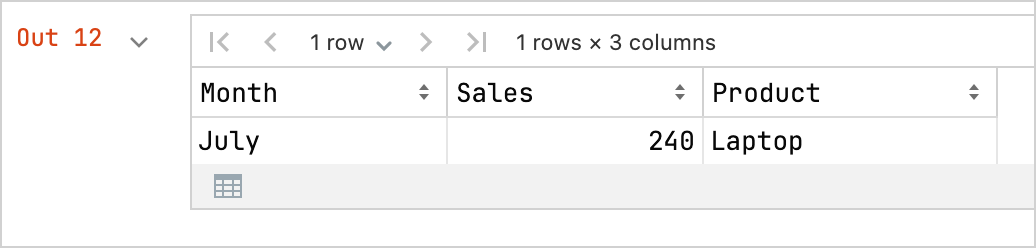
데이터 프레임을 CSV 파일로 내보낼 수도 있습니다:
kotlin// 데이터를 CSV 형식으로 내보내기 dfSales.writeCSV("sales-stats.csv")
차트
Kotlin Notebook에서 직접 다양한 차트를 생성하여 데이터를 시각화할 수 있습니다:
노트북에 Kandy 플로팅 라이브러리를 추가합니다:
none%use kandy동일한 데이터 프레임을 사용하고 새 셀에서
plot()함수를 실행합니다:kotlinval salesPlot = dfSales.groupBy { Product }.plot { bars { // X축과 Y축에 사용되는 데이터 프레임의 열에 접근 x(Month) y(Sales) // 카테고리에 사용되는 데이터 프레임의 열에 접근하고 해당 카테고리의 색상을 설정 fillColor(Product) { scale = categorical( "Laptop" to Color.PURPLE, "Smartphone" to Color.ORANGE, "Tablet" to Color.GREEN ) legend.name = "Product types" } } // 차트의 모양 사용자 정의 layout.size = 1000 to 450 layout.title = "Yearly Gadget Sales Results" } salesPlot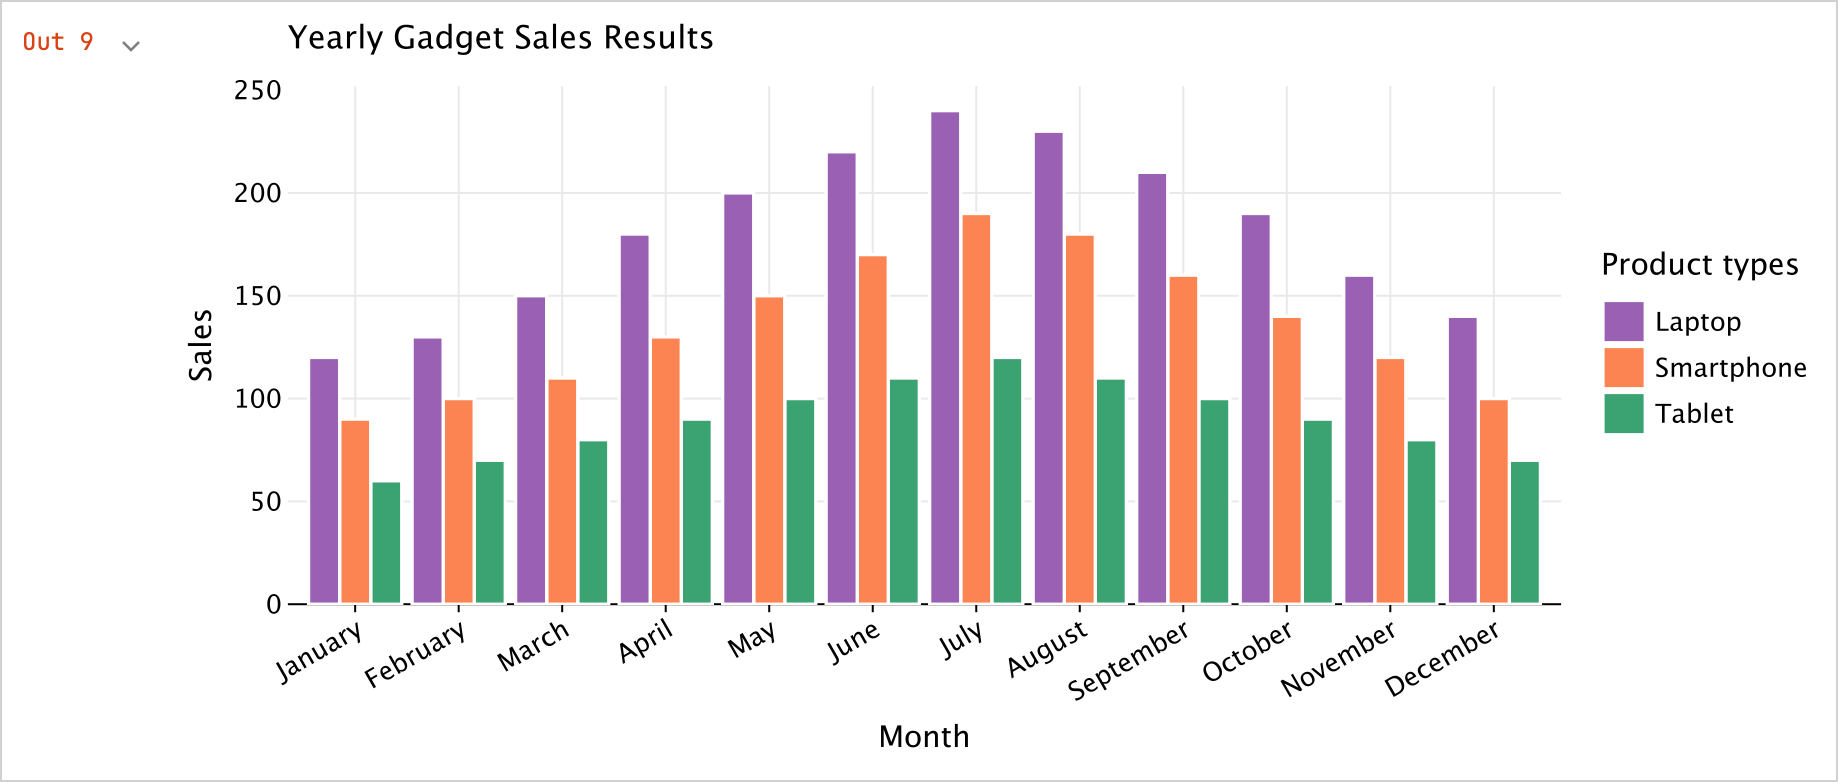
플롯을
.png,jpeg,.html또는.svg형식으로 내보낼 수도 있습니다:kotlin// 플롯 파일의 출력 형식 지정: salesPlot.save("sales-chart.svg")