Kotlin Notebook 支持的输出格式
Kotlin Notebook 支持多种输出类型,包括文本、HTML 和图像。借助于外部库,你可以扩展输出选项,并使用图表、电子表格等实现数据可视化。
每个输出都是一个 JSON 对象,它将 Jupyter MIME 类型映射到某些数据。Kotlin Notebook 会从该映射中选择其他类型中优先级最高的受支持 MIME 类型,并按如下方式渲染:
- 文本使用
text/plainMIME 类型。 BufferedImage类使用映射到 Base64 字符串的image/pngMIME 类型。Image类以及 LaTeX 格式使用内部带有img标记的text/htmlMIME 类型。- Kotlin DataFrame 表格和 Kandy 图表使用它们自己的内部 MIME 类型,这些类型由静态 HTML 或图像支持。通过这种方式,你可以在 GitHub 上显示它们。
你可以手动设置映射,例如,将 Markdown 用作单元格输出:
MimeTypedResult(
    mapOf(
        "text/plain" to "123",
        "text/markdown" to "# HEADER",
        //其他 mime:value 对
    )
)
要显示任何类型的输出,请使用 DISPLAY() 函数。它还可以实现多个输出的组合:
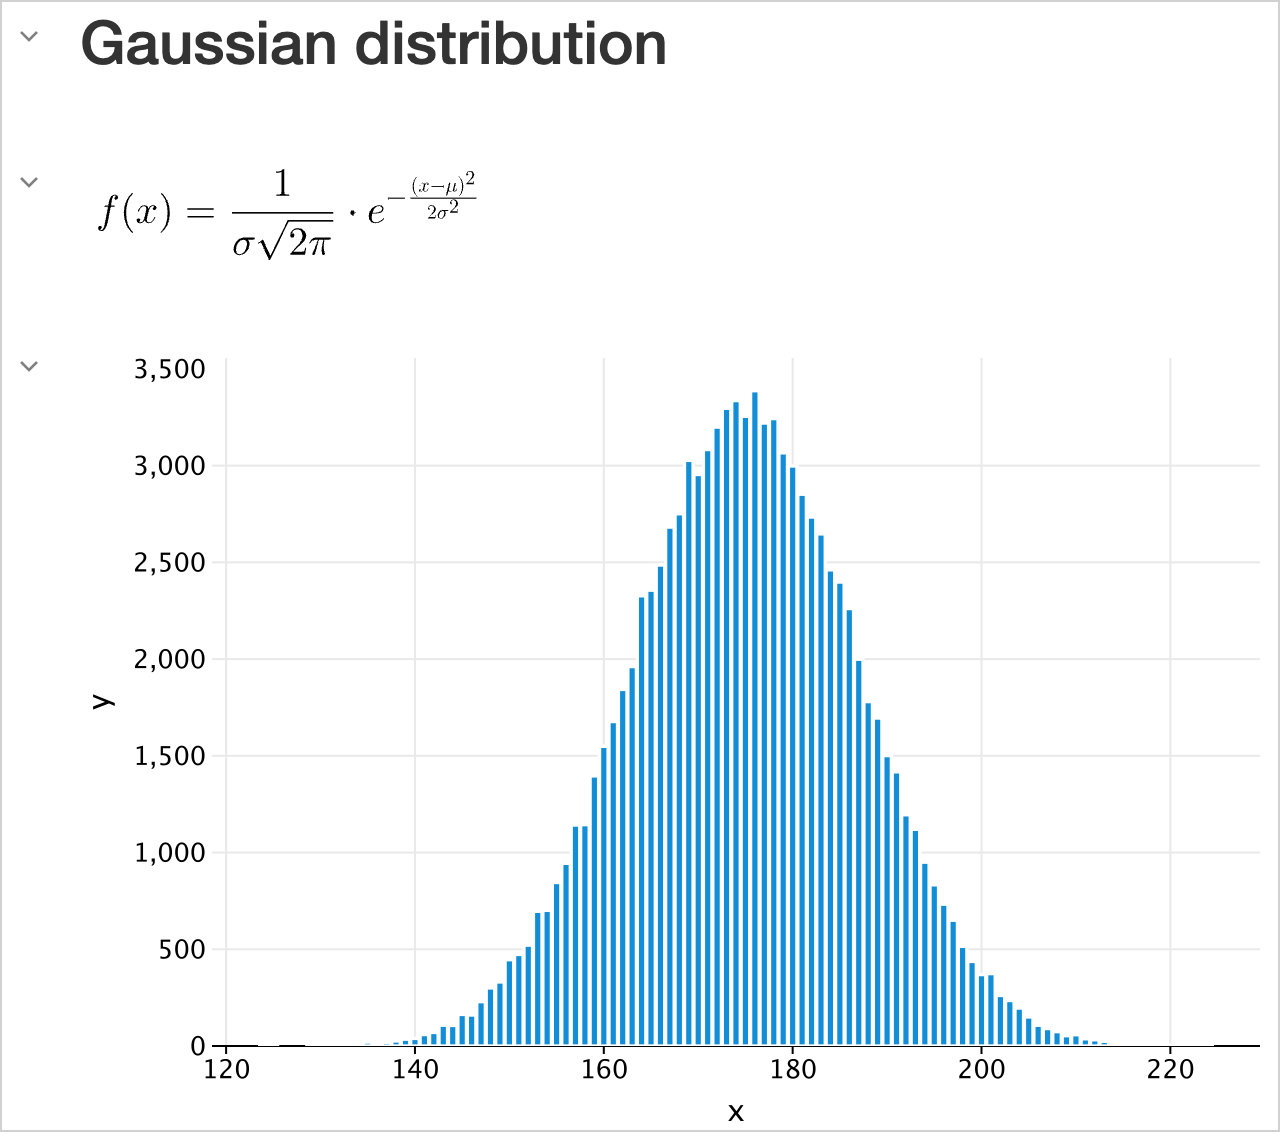
DISPLAY(HTML("<h2>Gaussian distribution</h2>"))
DISPLAY(LATEX("f(x) = \\frac{1}{\\sigma \\sqrt{2\\pi}} \\cdot e^{-\\frac{(x - \\mu)^2}{2\\sigma^2}}"))

val experimentX = experimentData.map { it.key }
val experimentY = experimentData.map { it.value }

DISPLAY(plot {
    bars {
        x(experimentX)
        y(experimentY)
    }
})
文本
纯文本
最简单的输出类型是纯文本。它用于打印语句、变量值或代码中任何基于文本的输出:
val a1: Int = 1
val a2: Int = 2
var a3: Int? = a1 + a2

"My answer is $a3"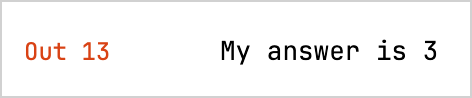
- 如果单元格的结果无法被渲染并显示为任何输出类型,它将使用
toString()函数以纯文本形式打印。 - 如果你的代码包含错误,Kotlin Notebook 会显示错误消息和堆栈跟踪,为调试提供见解。
富文本
选择 Markdown 类型的单元格以使用富文本。通过这种方式,你可以使用列表、表格、字体样式、代码块等 Markdown 和 HTML 标记来格式化内容。HTML 可以包含 CSS 样式和 JavaScript。
## Line magics

| Spell                              | Description                                                                                                      | Example                                                                               |
|------------------------------------|------------------------------------------------------------------------------------------------------------------|---------------------------------------------------------------------------------------|
| <code>%use</code>                  | Injects code for supported libraries: artifact resolution, default imports, initialization code, type renderers. | <code>%use klaxon(5.5), lets-plot</code>                                              |
| <code>%trackClasspath</code>       | Logs any changes of current classpath. Useful for debugging artifact resolution failures.                        | <code>%trackClasspath [on |off]</code>                                                |
| <code>%trackExecution</code>       | Logs pieces of code that are going to be executed. Useful for debugging of libraries support.                    | <code>%trackExecution [all|generated|off]</code>                                      |
| <code>%useLatestDescriptors</code> | Use latest versions of library descriptors available. By default, bundled descriptors are used.                  | <code>%useLatestDescriptors [on|off]</code>                                           |
| <code>%output</code>               | Output capturing settings.                                                                                       | <code>%output --max-cell-size=1000 --no-stdout --max-time=100 --max-buffer=400</code> |
| <code>%logLevel</code>             | Set logging level.                                                                                               | <code>%logLevel [off|error|warn|info|debug]</code>                                    |

<ul><li><a href="https://github.com/Kotlin/kotlin-jupyter/blob/master/docs/magics.md">了解更多关于行 Magics 的细节</a>。</li>
<li><a href="https://github.com/Kotlin/kotlin-jupyter/blob/master/docs/magics.md">查看受支持库的完整列表</a>。</li></ul>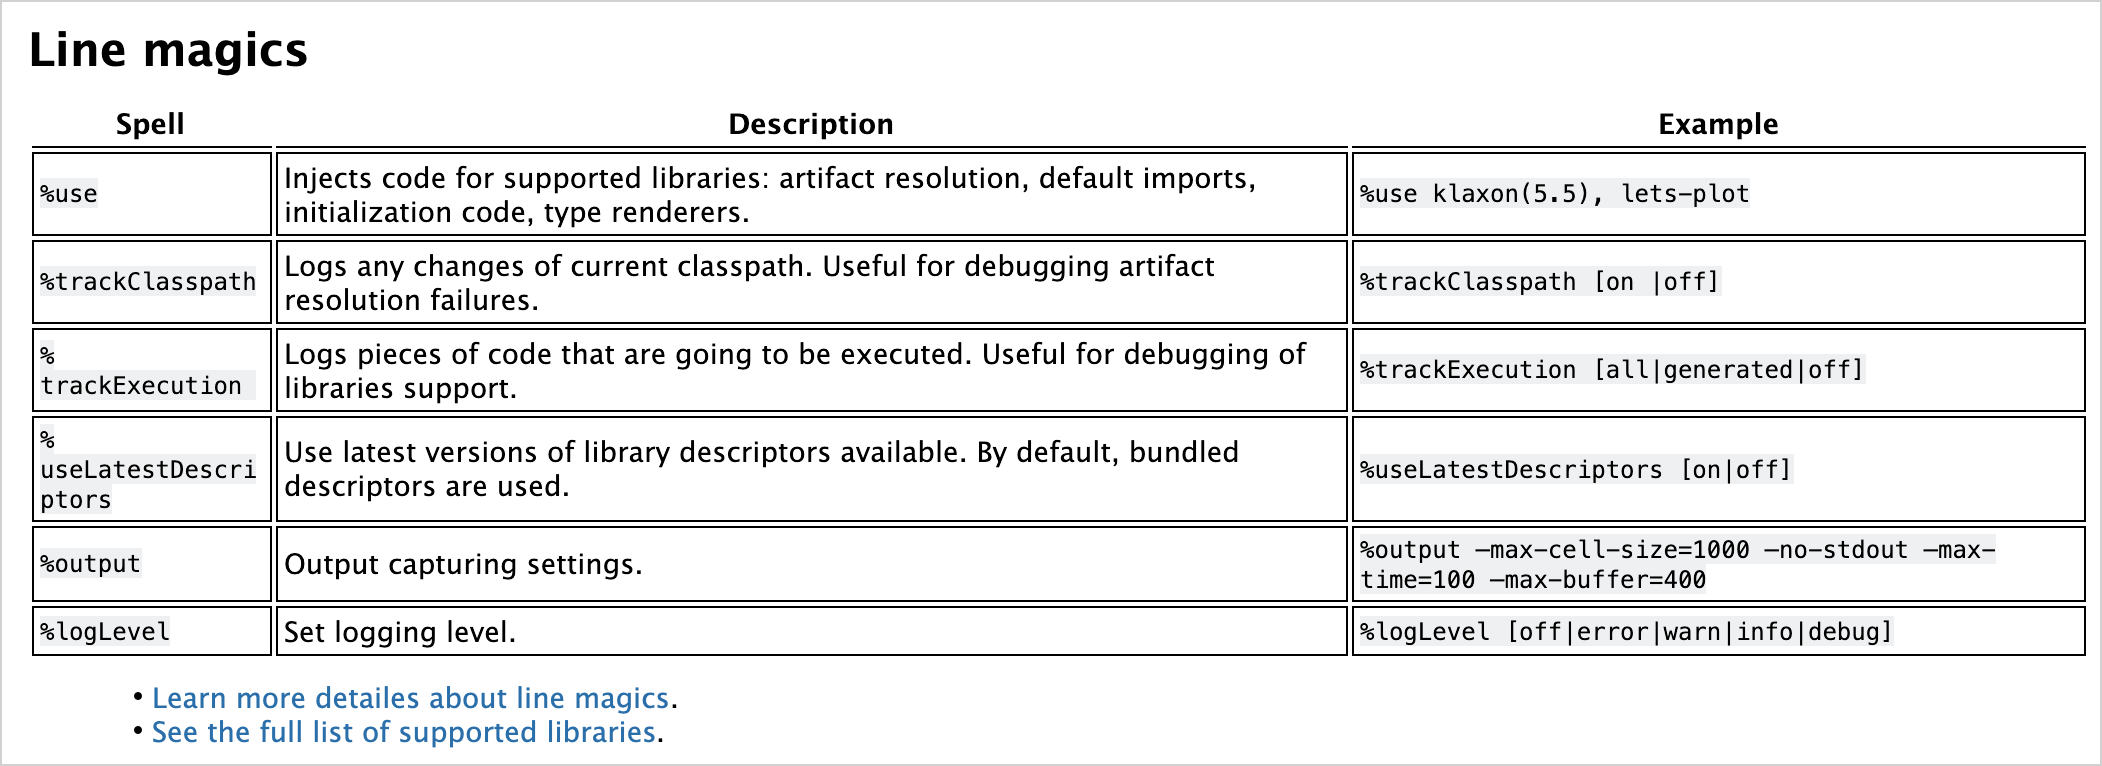
HTML
Kotlin Notebook 可以直接渲染 HTML、执行脚本甚至嵌入网站:
HTML("""
<p>Counter: <span id="ctr">0</span> <button onclick="inc()">Increment</button></p>
<script>
    function inc() {
        let counter = document.getElementById("ctr")
        counter.innerHTML = parseInt(counter.innerHTML) + 1;
}
</script>
""")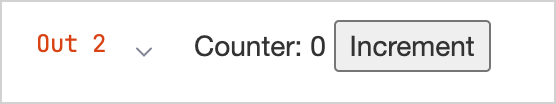
在文件顶部将你的笔记本标记为 Trusted,以便能够执行脚本。
图像
通过 Kotlin Notebook,你可以显示来自文件的图像、生成的图形或任何其他视觉媒体。静态图像可以以 .png、jpeg 和 .svg 等格式显示。
缓冲图像
默认情况下,你可以使用 BufferedImage 类来显示图像:
import java.awt.Color
import java.awt.image.BufferedImage

val width = 300
val height = width

val image = BufferedImage(width, height, BufferedImage.TYPE_INT_ARGB)

val graphics = image.createGraphics()
graphics.background = Color.BLACK
graphics.clearRect(0, 0, width, height)
graphics.setRenderingHint(
    java.awt.RenderingHints.KEY_ANTIALIASING,
    java.awt.RenderingHints.VALUE_ANTIALIAS_ON
)
graphics.color = Color.WHITE
graphics.fillRect(width / 10, height * 8 / 10, width * 10 / 20, height / 10)
graphics.dispose()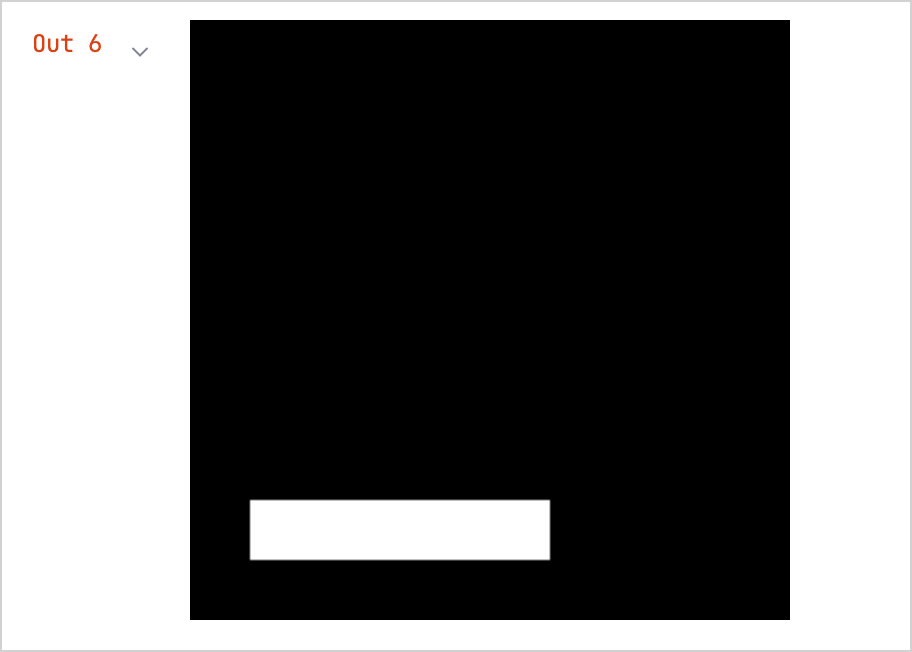
加载的图像
借助 lib-ext 库,你可以扩展标准 Jupyter 功能并显示从网络加载的图像:
%use lib-ext(0.11.0-398)Image("https://kotlinlang.org/docs/images/kotlin-logo.png", embed = false).withWidth(300)
嵌入式图像
从网络加载图像的一个缺点是,如果链接断开或失去网络连接,图像就会消失。为了解决这个问题,可以使用嵌入式图像,例如:
val kotlinMascot = Image("https://blog.jetbrains.com/wp-content/uploads/2023/04/DSGN-16174-Blog-post-banner-and-promo-materials-for-post-about-Kotlin-mascot_3.png", embed = true).withWidth(400)
kotlinMascot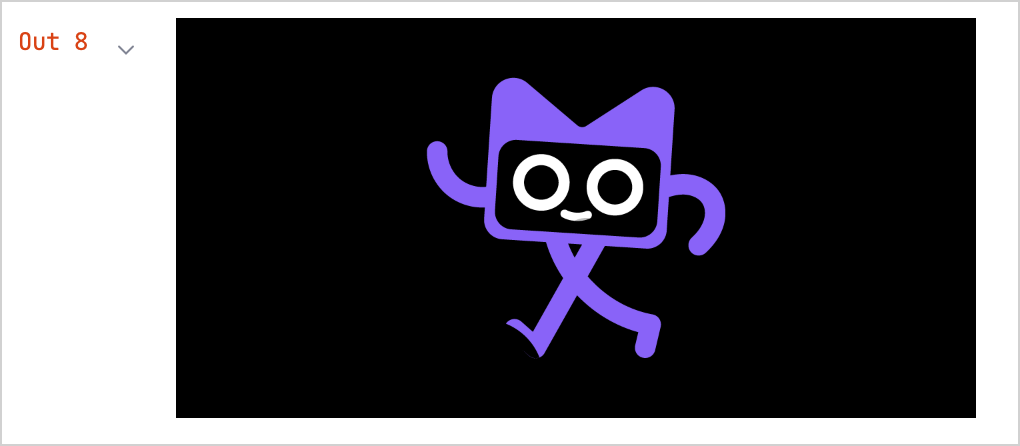
数学公式和方程
你可以使用 LaTeX 格式渲染数学公式和方程,这是一种在学术界广泛使用的排版系统:
将扩展 Jupyter 内核功能的
lib-ext库添加到你的笔记本:none%use lib-ext(0.11.0-398)在新单元格中运行你的公式:
noneLATEX("c^2 = a^2 + b^2 - 2 a b \\cos\\alpha")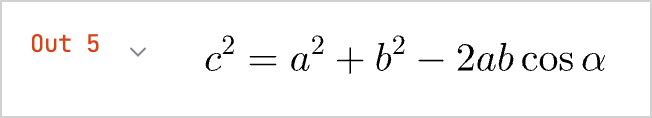
数据帧
通过 Kotlin Notebook,你可以使用数据帧对结构化数据进行可视化:
将 Kotlin DataFrame 库添加到你的笔记本:
none%use dataframe创建数据帧并在新单元格中运行:
kotlinval months = listOf( "January", "February", "March", "April", "May", "June", "July", "August", "September", "October", "November", "December" ) // 不同产品和月份的销售数据: val salesLaptop = listOf(120, 130, 150, 180, 200, 220, 240, 230, 210, 190, 160, 140) val salesSmartphone = listOf(90, 100, 110, 130, 150, 170, 190, 180, 160, 140, 120, 100) val salesTablet = listOf(60, 70, 80, 90, 100, 110, 120, 110, 100, 90, 80, 70) // 包含 Month、Sales 和 Product 列的数据帧 val dfSales = dataFrameOf( "Month" to months + months + months, "Sales" to salesLaptop + salesSmartphone + salesTablet, "Product" to List(12) { "Laptop" } + List(12) { "Smartphone" } + List(12) { "Tablet" }, )该数据帧使用
dataFrameOf()函数,包含了在 12 个月内销售的产品数量(笔记本电脑、智能手机和平板电脑)。探索数据帧中的数据,例如,查找销售额最高的产品和月份:
nonedfSales.maxBy("Sales")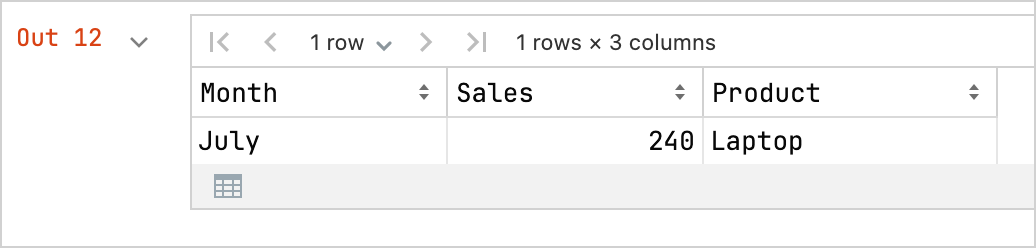
你还可以将数据帧导出为 CSV 文件:
kotlin// 将你的数据导出为 CSV 格式 dfSales.writeCSV("sales-stats.csv")
图表
你可以直接在 Kotlin Notebook 中创建各种图表,以实现数据的可视化:
将 Kandy 绘图库添加到你的笔记本:
none%use kandy使用相同的数据帧并在新单元格中运行
plot()函数:kotlinval salesPlot = dfSales.groupBy { Product }.plot { bars { // 访问用于 X 轴和 Y 轴的数据帧列 x(Month) y(Sales) // 访问用于类别的数据帧列并为这些类别设置颜色 fillColor(Product) { scale = categorical( "Laptop" to Color.PURPLE, "Smartphone" to Color.ORANGE, "Tablet" to Color.GREEN ) legend.name = "Product types" } } // 自定义图表外观 layout.size = 1000 to 450 layout.title = "Yearly Gadget Sales Results" } salesPlot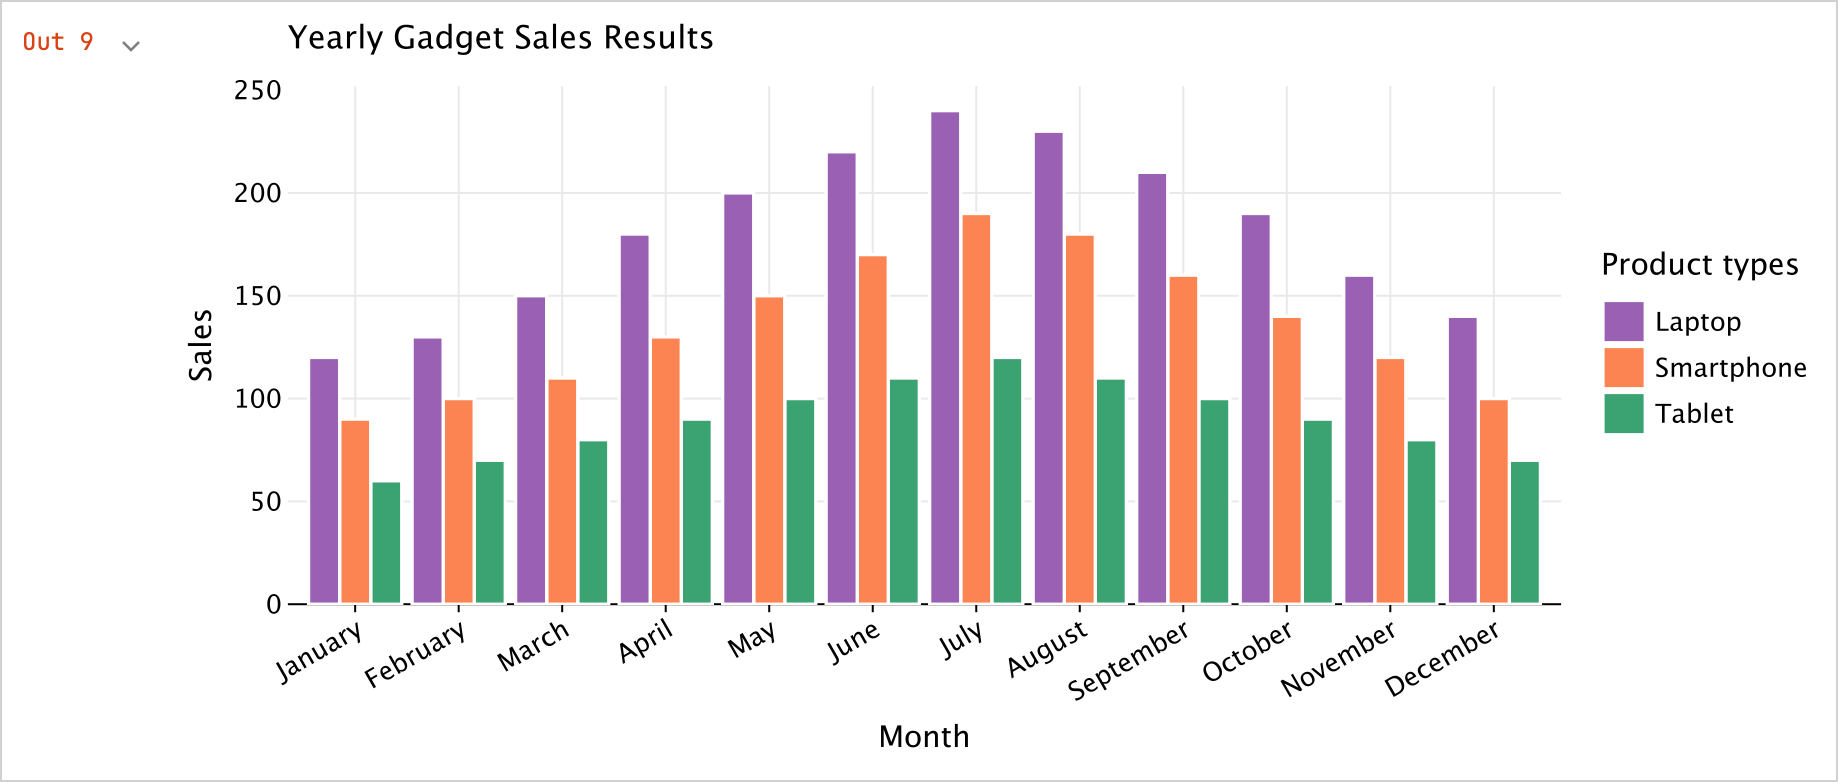
你还可以将图表导出为
.png、jpeg、.html或.svg格式:kotlin// 指定图表文件的输出格式: salesPlot.save("sales-chart.svg")